Google Shopping Ads Market Analysis for Arts & Entertainment
This market analysis shows the top advertisers and their overall visibility in Digital shelf using search intelligence of GrowByData for arts & entertainment.
Google Shopping Ads are an important part of the Shopper’s Journey, especially amongst US retail shoppers. It is one of the most popular choices for consumers who are at any stage of their buying decision. With Online Marketing Intelligence Software, GrowByData has been analyzing shopping ad trends across all the retail categories and we have been seeing tremendous competition amongst retailers to improve their visibility in this particular ad format.
For this analysis, the Search Intelligence tool collected shopping ads data from 1,458 Arts & Entertainment category-related keywords with high search volumes and analyzed the performance of their ads in March 2021. We detected around 370,826 ads with 58,911 ad titles from 3,636 retailers on google shopping.
From the analysis of ads type distribution and devices ad coverage respectively, we found that 84% of total ads were seen on mobile devices and only 16% were seen on desktops during the month. Also, some interesting insights discovered by our experts include ad trends among advertisers, regional ad distributions, top advertisers by region and device, ad rank of advertisers, products per price range, and google shopping ad extensions used by advertisers.
Before diving into the insights, look at GrowByData Google Market Pulse for Apparel & Accessories.
Shopping Ads Visibility Trend for March
For the category Arts & Entertainment, we collected the ad data daily from March 1st to March 31st, 2021 from 4 different regions in the US – East, Midwest, Southwest, and Northwest. In the trend graph below, we can see that the number of ads seen fluctuated quite a bit at the beginning and towards the end of the month. The ads remained constant during the middle part of the month till the 22nd of March and then jumped up for a week before dropping again.
Total Ads: 370,826 Total Sellers: 3,636 Number of keywords: 1,458 Ad Titles: 58,911
Regional Visibility of Shopping Ads
The regional analysis shows the visibility of the ads in the four U.S. regions- East, Midwest, Southwest, and Northwest. In the graph below we can see that the eastern region had the highest ad coverage with 29% of the ads related to the arts and entertainment category found in this region. This means the eastern region shoppers have more options in shopping ads and from a retailer’s standpoint, it's a more competitive region. It was followed closely by the southwest region which had 25% of the ad coverage. The Northwest and Midwest regions had much less ad coverage as they only saw 17% of the ads each. From an advertiser’s perspective, the Northwest and Midwest have comparatively less competition and can look to target shoppers in these regions.
Top 5 Advertisers based on Shopping Ads Visibility
Analyzing the top advertisers, we found that Amazon ads have the highest visibility in the Arts & Entertainment category with 34% of the ad impressions followed by Zazzle with 25%, Etsy with 15%, and Wayfair and Walmart with 13%. Amazon.com and Zazzle were by far the leaders in terms of ad coverage.
Per Region: Top 5 Retailers/Brands based on Shopping Ads Visibility
We analyzed the top 5 Retailers/Brand based on visibility from each of the 4 regions and found that Amazon.com, Zazzle, Walmart, and Wayfair had good coverage in all four regions. Amazon looks to be the top advertiser in three regions except in the northwest where Zazzle reigns on top.
Looking into the ad coverage of the top 5 Retailers/Brand based on the devices from each of the 4 regions we found the northwest region had a higher percentage of their ads visible on desktops and the Midwest region had the highest percentage of their ads on mobile devices. Most of the ads were seen on mobile devices in all four regions, compared to desktop devices. This means retailers have more opportunities to improve search findability on desktop devices to win the attention of the digital shopper.
Shopping Ads Visibility by Rank
The graph below shows the top 5 advertisers based on the highest percentage of ads at each rank in the Arts & Entertainment category. Over 40% of the ads from Amazon were found in the top 5 ranks in this category. This shows Amazon had good search findability and is leading in this set of keywords targeting shoppers in all stages of the purchase journey. An advertiser like Wayfair who had one of the top ad coverages did not have many of their ads in the top 5. This means although they had a lot of ads, they have plenty of space for improving their Shopping Ads Position.
Products per Price Range
Looking into the price range of products for the Arts & Entertainment category, we found the highest percentage (72%) of the products was in the price range of $0-$50 and the least percentage (13%) of the products were in the price range above $150. And, 15% of the products were in the price range of $50-$150. Price is certainly an important factor in the buying decision amongst a majority of shoppers and data also shows retailers/brands are pushing their cheapest product more to increase their Conversion Rate in Google Shopping Ads.
Use of Auto Annotations
From our analysis, we saw that most arts & entertainment ads only use the ‘price drop’ and ‘sale’ auto annotations. In this category, both the ‘sale’ annotation and ‘price drop’ annotation was used by only 1% of the ads. There is a good opportunity for retailers and brands on Google Shopping to increase their conversion by using more auto annotations on their ads.
Use of Shipping Annotations
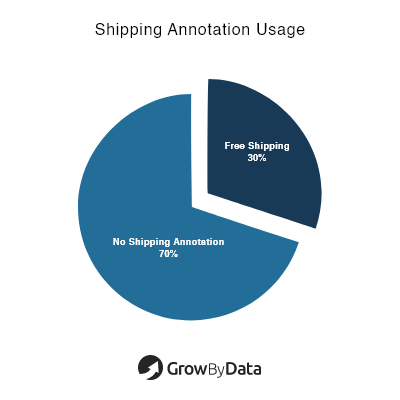
As per our data on the use of shipping annotations, the ‘Free Shipping’ annotation seemed to be the most popular one. 30% of ads in our analysis had shipping annotations and 70% of the ads had no shipping annotation on them. Using shipping annotations can help arts & entertainment advertisers on Google Shopping to stand out.
Use of Local Inventory Ads
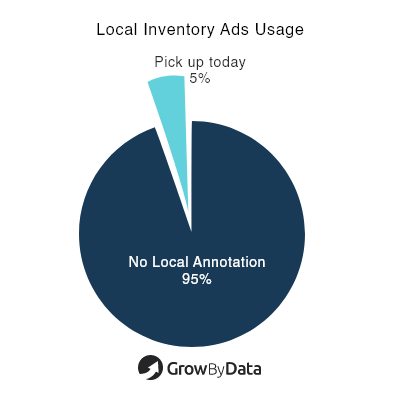
By analyzing our data on the use of local inventory ads, we found only 5% of advertisers used local inventory ads with the ‘Pickup Today’ tag on them. The remaining 95% of ads had not used any local inventory annotations. Advertisers have a very good opportunity to target their local shoppers and win impressions in Google Shopping using local inventory Ads.
Use of Ratings and Reviews
For ratings and reviews, the Arts & Entertainment category had 19% of ads with rating scores of more than 4 on Google Shopping. Looking at the review count data, we found that 12% of the ads had more than 100 reviews, 14% of the ads had less than 100 reviews and the remaining 74% had no reviews on them. Having a higher review and ratings is another way to stand out amongst the competition which improves your product buy-ability factor.
Conclusion
The article provides holistic and granular visibility based on the performance of ads in the Arts & Entertainment category which shows the overall trends of Google Shopping Ads. Our experts discovered areas for arts & entertainment advertisers to optimize for search as well as for shoppers. The daily SERP monitoring and granular data analysis from Search Intelligence give unprecedented visibility uncovering crucial opportunities for optimizing digital shelf visibility.


